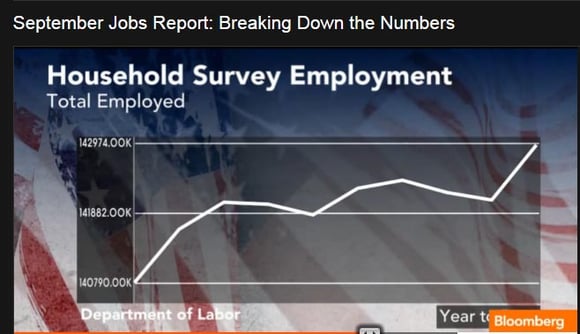
This morning the monthly jobs report was issued and we created 114,000 jobs. From our perspective this is just an average number and does not match the number of new people entering the workforce. Interestingly, the unemployment rate dropped by 0.3%, so how can that be? As we were combing through the data, we noticed a bizarre anomaly in the calculation. The household survey which is used to calculate the unemployment rate went dramatically higher in the last month. Roughly 875,000 jobs were added based upon this survey. The survey is based upon the fed calling and interviewing roughly 60 thousand households. Somehow out of nowhere everyone starting working as this is the biggest gain in the household survey since June of 1983 and more than double the size of previous months . We believe there is something fishy in that data. The household survey is a sample and it spiked so high, we smell a rat. Our expectation is that this will be adjusted downward by a relatively big amount in the next report.
Below is a chart showing the change in the household survey. Notice the unlikely spike:


